QIAGEN IPA
IPA deeper dive: Making most out of user’s core/expression analysis and new features
804 views
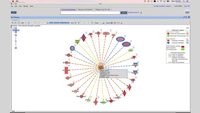
Many of you who use QIAGEN Ingenuity Pathway Analysis (IPA) have requested a deeper dive into the IPA core analysis (also known as expression analysis), which is - performed on RNA-seq, scRNA-seq, proteomics and many other types of ‘omics data). You’ve specifically requested to cover topics like causal networks, regulator effects, etc., in more detail. That’s why we’ve designed this training to focus on these topics and more:
· What are the different result types of results produced by an IPA core analysis?
· What are the differences between causal network vs. mechanistic network vs. regulator effects?
· How do you predict molecular activity in IPA? What is a Z-score? · What is the new bubble plot feature?
· How can I edit, expand and modify the network the way I want it? For example, add a disease or gene(s) of interest, remove certain connections, etc?
Related videos
QIAGEN IPA
Analyze, compare and contextualize your biological data with QIAGEN IPA
Discover why QIAGEN Ingenuity Pathway Analysis (IPA) is more than just...
QIAGEN IPA
Interpreting your comparison analyses results in IPA
Learn how to view and interpret your comparison analyses results in IPA and...
QIAGEN IPA
New user training: QIAGEN Ingenuity Pathway Analysis (IPA)
New user training: Large dataset analysis and knowledge base queries using...
QIAGEN IPA
Interpreting the Results of Your Phosphoproteomics Analysis in IPA
Learn how to view and interpret your Phosphoproteomics Analysis results in...


