QIAGEN IPA
Interpreting your comparison analyses results in IPA
12,739 views
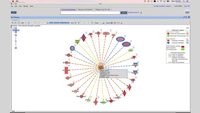
Learn how to view and interpret your comparison analyses results in IPA and the multiple ways of relating the molecules in your dataset to the body of information in the Ingenuity Knowledge Base. IPA allows you to compare analysis results from multiple experimental groups to identify similarities, differences, and trends. Heatmaps for Canonical Pathways, Upstream Regulators, and Diseases & Functions allow you to easily and quickly view information from your analyses side-by-side. You can also visualize Gene Heatmaps to gain instant insight into specifically how genes affect your results.
Related videos
QIAGEN IPA
Analyze, compare and contextualize your biological data with QIAGEN IPA
Discover why QIAGEN Ingenuity Pathway Analysis (IPA) is more than just...
QIAGEN IPA
New user training: QIAGEN Ingenuity Pathway Analysis (IPA)
New user training: Large dataset analysis and knowledge base queries using...
QIAGEN IPA
Interpreting the Results of Your Phosphoproteomics Analysis in IPA
Learn how to view and interpret your Phosphoproteomics Analysis results in...
QIAGEN IPA
Proteomics and phosphoproteomics data interpretation using QIAGEN Ingenuity Pathway Analysis
In this QIAGEN IPA training, we’ll focus on interpreting proteomics and...


