QIAGEN IPA
IPA Interpret graphical summary
94 views
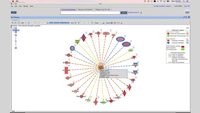
The Graphical Summary in IPA Interpret has been made more informative and easier to interpret. In Upstream Regulators, you can easily see the dataset details for genes in the summary. A tooltip now provides information about the Upstream Regulator’s score from your analysis and expression details (if the gene is in your dataset). This way, you can evaluate the expression of the underlying gene and view its prediction as a regulator at the same time.
Related videos
QIAGEN IPA
Analyze, compare and contextualize your biological data with QIAGEN IPA
Discover why QIAGEN Ingenuity Pathway Analysis (IPA) is more than just...
QIAGEN IPA
Interpreting your comparison analyses results in IPA
Learn how to view and interpret your comparison analyses results in IPA and...
QIAGEN IPA
New user training: QIAGEN Ingenuity Pathway Analysis (IPA)
New user training: Large dataset analysis and knowledge base queries using...
QIAGEN IPA
Interpreting the Results of Your Phosphoproteomics Analysis in IPA
Learn how to view and interpret your Phosphoproteomics Analysis results in...


