QIAGEN IPA
IPA Interpret bubble charts
161 views
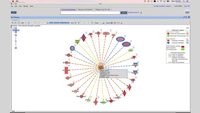
New in IPA Interpret, bubble charts can help you find interesting patterns in your results, focus on the most important predictions and create compelling visualizations for presentation and publications.
Related videos

Discover why QIAGEN Ingenuity Pathway Analysis (IPA) is more than just...

Learn how to view and interpret your comparison analyses results in IPA and...

New user training: Large dataset analysis and knowledge base queries using...
Learn how to view and interpret your Phosphoproteomics Analysis results in...